|
|
|
A Sample Project - Page 4
|
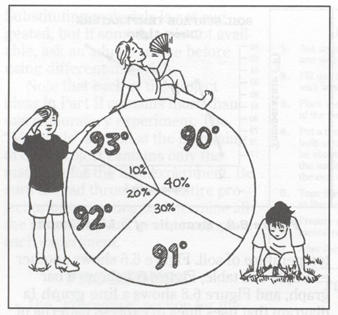
Figure 6.10 Pie Chart of Soil Surface Temperatures |
A
pictograph could be used to represent the results of an experiment measuring
wind speeds. A pictograph is a chart that contains symbols representing
data, such as quantities of an object In the pictograph shown in Figure
6.11, each flag represents wind speed of 1 mile per hour. Pictographs
are easy to read and can add a little fun to your data display.
|
|
|
 Figure
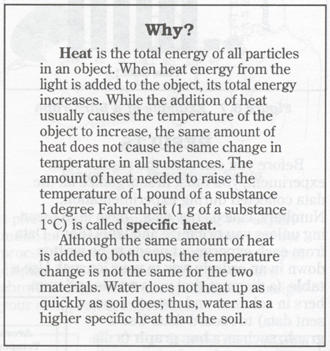
6.13 Sample Experiment "Why?"
Figure
6.13 Sample Experiment "Why?" |
|
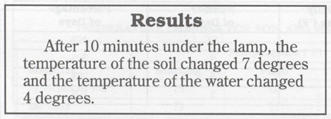
Figure 6.12 Sample Experiment Results |
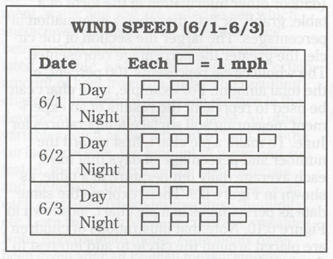 Figure
6.11 Example of a Pictograph
Figure
6.11 Example of a Pictograph